 |
 |
 |
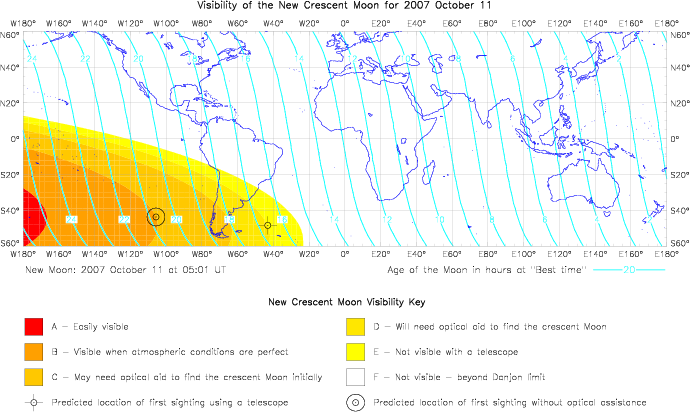
The following diagrams show the visibility of the
new crescent Moon over the first three days of the
lunation. The unshaded areas indicate regions from which
the Moon cannot be seen. The Moon becomes more easily
visible from the regions of increasing colour intensity
i.e. the Moon will be seen easily from the regions shown
in red. The near vertical blue lines show the age of the
Moon at the so-called "best time" of
observation.
The following diagram shows the
visibility of the new crescent Moon on 2007 October
11. |
 |
 |
 |
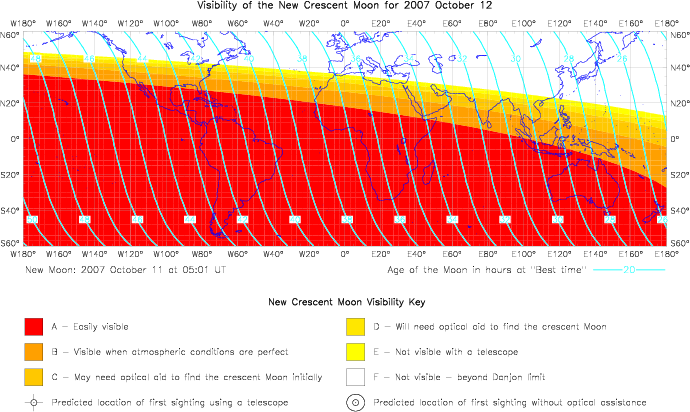
| The second diagram is for 2007 October 12 and
exhibits more shaded regions than those found in the map
for 2007 October 11. Consequently, a larger fraction of
the surface of the Earth will be able to observe the
crescent Moon with ease. |
 |
 |
 |
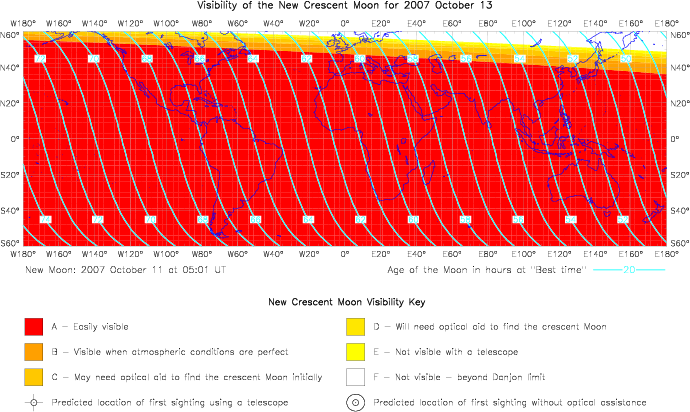
| The third diagram is for 2007 October 13 and is
almost totally shaded in red. The majority of the Earth
will be able to observe the crescent Moon with
ease. |
 |
 |
 |
| Global Visibility Maps for previous
months |
| |
| Several requests have been made to make available
the global visibility maps for previous new crescent
moons. The following table contains links to the
visibility maps (in pdf format) for the first three days
of each lunation since the Moon Watch project started in
October 2005. Please use the browser's BACK button after
viewing the pdf files to return to this page. |
| |
|
|
| |
 |
