Hydraulic Jump
Theory
A hydraulic jump occurs when a confined liquid flowing at a
high velocity is exposed to a sudden reduction in pressure (often atmospheric
conditions) as it exits the confinement. In theory, the flow must be in
the supercritical range where the Froude number (NF) describes
critical flow:
 |
(1) |
where:
| u | is the fluid velocity (m/s) |
| g | is the acceleration of gravity (m/s2) |
| y | is the depth of the fluid stream (m) |
If NF = 1, the flow is considered critical
If NF
< 1, the flow is considered subcritical
If NF > 1, the flow
is considered supercritical
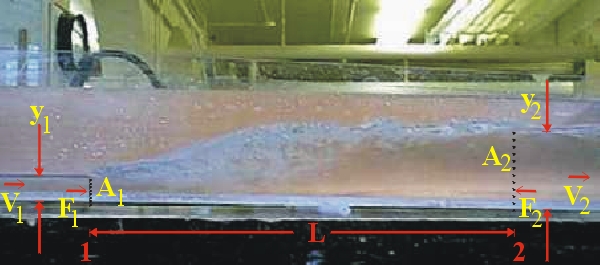
Consider the following steady but non-uniform flow in a rectangular channel of width w:
If we start with the continuity equation:
 |
(2) |
Rearranging and simplifying:
 |
(3) |
Recall that the hydrostatic forces exerted at the cross sections 1 and 2 is:
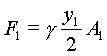 |
(4) |
and
 |
(5) |
For moving fluids, force is also described in terms of momentum:
|
|
(6) |
Substituting equations 3 and 4 into 5 and expanding the mass flow rate:
 |
(7) |
Since ![]()
 |
(8) |
Since r = g/g and
substituting for V2 from equation 2, equation 7 can be manipulated
into:
 |
(9) |
Since ![]() is the Froude number squared:
is the Froude number squared:
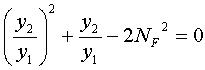 |
(10) |
Solving the quadratic:
 |
(11) |
The downstream depth is therefore predicted in terms of the upstream depth and the Froude number.
The energy loss through the turbulent transition in velocity is given by:
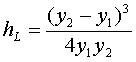 |
(12) |
| Equipment Pump Plexiglas trough and end weir Piping and valves Stopwatch Bucket |
 |
Procedure
 |
 |
 |
(13) |
Theoretically, a plot of y2/y1 vs NF would
yield a slope of ![]() with an intercept of -1/2. How does this compare
to your plotted results? Comment on any differences.
with an intercept of -1/2. How does this compare
to your plotted results? Comment on any differences.